How to Read Candlestick Charts: A Beginner’s Guide
If you are a newbie in trading, then you must not be aware of candlestick charts. It’s one of the powerful tools used by traders to monitor financial markets. Whether you trade in stocks, forex, cryptocurrencies, or commodities, candlestick charts are worth understanding price movements and market behaviour. It gives traders and investors an easy-to-read and understandable visual format.
For beginners, candlestick charts look a bit confusing, but decoding some basics helps in understanding the trade market and supports better decision-making. Let’s not waste your time here but explain candlestick charts within structure, meaning, value, and interpretation in the simplest way.
What Are Candlestick Charts?
Candlestick charts help in the practical display of the price movement of trades and stocks over a specific period. Each of the candlestick charts represents price action within a selective time frame, like one minute, one hour, one day, or even a month. It’s like simple line charts showing a closer look at prices.
Candlestick charts help in providing the four key pieces of information, like
- Opening price
- Closing price
- Highest price
- Lowest price
Typically, candlestick charts originated in Japan almost 300 years ago. Initially, it was used by rice traders to track market prices of trades and stocks and is now widely used within global financial markets.
Understanding the Structure of a Candlestick
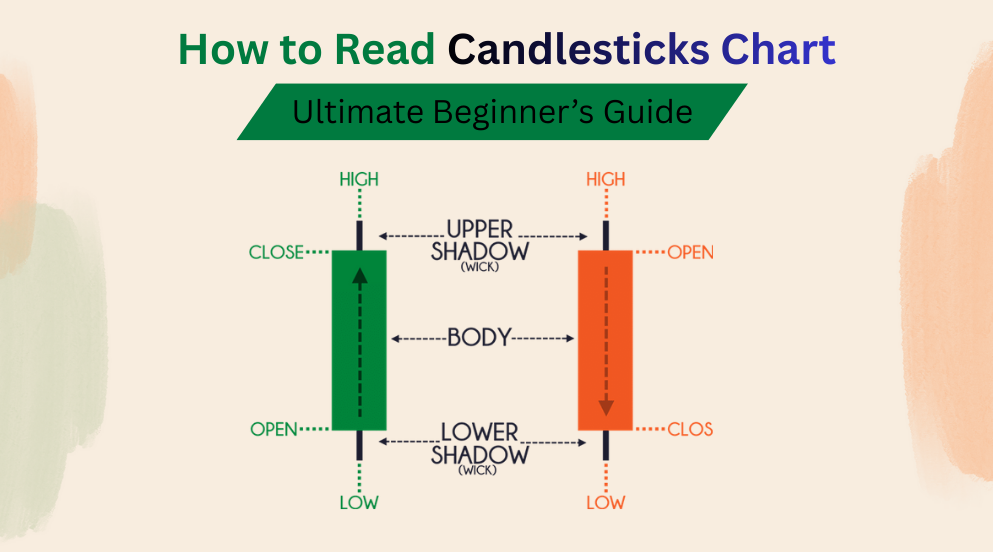
Each candlestick has two main parts:
- The body
- The wicks (or shadows)
The Body
The body shows the range between the opening and closing prices.
- The candle gets green or white when the closing price is higher than the opening price.
- A candle gets red or black if the closing price is lower than the opening price.
Typically, the size of the body indicates the strength of buying or selling pressure. The long body shows strong momentum; the other side, the short body, declares indecision or low activity.
The Wicks (Shadows)
The wicks extend above and below the body.
- The upper wick shows the highest price reached.
- The lower wick shows the lowest price reached.
Usually, long wicks suggest price rejection and strong reactions for both buyers and sellers in the trade market.
Bullish and Bearish Candlesticks
Traders who want to know the story of market sentiment—a candlestick does that.
Bullish Candlestick
The bullish candle forms when buyers keep control and push the prices higher. This eventually indicates optimism and potential continuation of an upward move.
Bearish Candlestick
The other side of a bearish candle helps in forming a scenario where sellers dominate the market and push the price down. This signals weakness or potential downward movement.
Candlestick Time Frames
Candlesticks can represent different time periods, and there is a rule for new traders to start with higher time frames, like 4-hour charts. It’s worth it as it ensures clearer signals and less noise.
- 1-minute candle: used for fast, short-term trading
- 15-minute or 1-hour candle: used for intraday analysis
- Daily candle: used for swing trading and long-term decisions
Single Candlestick Patterns
Traders must know that there are some candlesticks carrying specific meanings.
Doji
That forms during the opening and closing prices, and both get nearly equal. This signals the market indecision, which mostly appears before trend reversals.
Hammer
It’s a small body and a long lower wick, which appears as a downtrend. Hammer suggests that traders step in at the right time.
Shooting Star
This is a small body with a long upper wick and appears after an uptrend & indicates the potential for selling pressure.
Multiple Candlestick Patterns
These specific patterns get powerful when multiple candles form a sequence.
Bullish Engulfing Pattern
This pattern occurs during the large bullish candle and covers the previous bearish candle completely. It gives a strong shift from sellers to buyers.
Bearish Engulfing Pattern
A large bearish candle engulfs the previous bullish candle, indicating a potential downward move.
Morning Star
This three-candle pattern signals a bullish reversal after a downtrend.
Evening Star
This pattern signals a bearish reversal after an uptrend.
Reading Candlesticks in Context
Understand this—candlesticks shouldn’t be analysed alone. Precisely, the context is important. The key factors traders consider include
- Overall trend direction
- Support and resistance levels
- Trading volume
- Market news or events
Support and Resistance With Candlesticks
With candlesticks, support is a price level where buying pressure is quite strong to stop the cost from falling any further. On the other side, resistance is followed where selling pressure prevents prices from unexpectedly rising. So, candlesticks within these patterns or nearby often level up the trading signals with high probability.
Common Beginner Mistakes When Reading Candlestick Charts
Beginners usually misunderstand the candlesticks. It happens due to a lack of experience. Typically, patience and practice are the keys to avoiding errors.
Common mistakes include:
- Trading every candlestick pattern
- Ignoring the trend
- Using very low time frames
- Overanalyzing single candles
Trading without confirmation
Combining Candlestick Charts With Indicators
As already said, candlestick charts are a powerful tool for traders; just right combining with indicators makes them more effective, like
- Moving averages
- Relative Strength Index (RSI)
- Volume indicators
The above-mentioned indicators help confirm signals and improve accuracy.
Why Candlestick Charts Are Important for Beginners
Typically, candlestick charts ensure clarity, structure, and visual simplicity. Therefore, help traders to
- Identify trends early
- Spot reversals
- Measure momentum
- Improve timing of entries and exits
Practising Candlestick Reading
For beginners, understanding candlestick charts isn’t easy, yet it can be learnt with practice. New traders should
- Observe charts daily
- Study historical patterns
- Use demo accounts
- Focus on a few patterns at first
Conclusion
Let’s sum up here with a verdict—candlestick charts are essential and powerful tools when someone enters the trading world. It usually shows trading market trends, psychology, and price behaviour. Understanding may be difficult for new traders, but practice can make it easier to learn for precise interpretation. Mastering the basics about the candlestick charts and practising will improve traders’ approach to reading the trading marketing trends.
It’s a must for new traders to understand the structure, common patterns, and how to analyse the trade, which is helpful with candlestick charts. Over time, candlestick charts become more than just colored bars—they become a language that tells the story of the market.